
About Fusedash
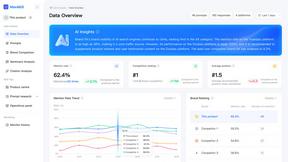
Fusedash is an AI-powered data visualization platform designed to eliminate the friction and inconsistency of modern data reporting. It serves as a unified workspace where teams can transform their connected data—from CSVs, APIs, or databases—into clear, actionable insights. The platform consolidates the creation of decision-ready dashboards, interactive charts, detailed maps, and narrative reports, removing the need to rebuild the same logic across multiple, disconnected tools. Its core value proposition is delivering a single source of truth: you define your key metrics and KPIs once, and then reuse those consistent definitions across every view and report. This ensures alignment across the entire organization, from leadership to operations, so everyone is working from the same trusted numbers. Built for teams tired of manual reporting cycles and conflicting data stories, Fusedash empowers users to not only monitor real-time performance but also understand the 'why' behind the data through intuitive drill-downs. With integrated AI features like natural language data chat and smart visualization assistance, it makes data exploration and reporting faster and more accessible, turning raw data into a shared foundation for strategic alignment and decisive action.
Features of Fusedash
Unified Visualization Workspace
Fusedash consolidates multiple data presentation formats into a single, cohesive environment. Instead of juggling separate tools for dashboards, charts, maps, and reports, teams can build all these views from the same connected dataset. This unified approach allows for seamless switching between interactive dashboards for monitoring, detailed charts for analysis, geographic maps for spatial context, and narrative storytelling reports for stakeholder communication, all while maintaining consistent data logic and definitions.
AI Chart Generator
This feature accelerates the initial step of data exploration by allowing users to generate clear, effective visuals from their data in minutes. By simply uploading a CSV or connecting an API, the AI assists in selecting the optimal chart type, applying relevant comparisons, and refining labels to ensure the visual accurately tells the data's story. These charts can be used as standalone assets for quick reports or seamlessly integrated into larger, more comprehensive dashboard views.
Consistent Metric Definitions
Fusedash addresses a fundamental pain point in data-driven organizations: metric inconsistency. Teams can define their core KPIs, dimensions, time comparisons, and segmentations once within the platform. These standardized definitions are then automatically applied and reused across every dashboard, chart, and report. This guarantees that everyone in the organization—from marketing to finance to the C-suite—is analyzing and making decisions based on the exact same calculations, building trust and eliminating debates over data accuracy.
Smart AI Chat for Data Exploration
Integrated directly into the workflow, the AI Chat function allows users to interact with their data using natural language. Users can ask plain-English questions about their datasets, request specific breakdowns, or seek suggestions for the most relevant metrics and visualizations. The AI interprets these queries and provides immediate answers, which can then be instantly transformed into a shareable, persistent view within a dashboard, dramatically speeding up the insight discovery process.
Use Cases of Fusedash
Executive Reporting and Leadership Alignment
Leadership teams require a high-level, consistent view of company performance without getting lost in data discrepancies. Fusedash enables the creation of executive dashboards that combine key financial, operational, and marketing KPIs into a single, real-time interface. By using standardized metric definitions, it ensures that the numbers presented to the board are the same ones used by department heads, fostering strategic alignment and confident, data-backed decision-making at the top level.
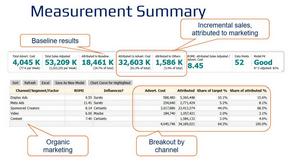
Marketing Campaign Performance Monitoring
Marketing teams need to track campaign metrics across multiple channels in real-time. With Fusedash, they can connect various ad platform APIs and data sources to build a unified campaign dashboard. They can visualize ROI, conversion rates, and customer acquisition costs through interactive charts, segment performance by region using maps, and use storytelling reports to summarize weekly performance and insights for stakeholders, all from one connected dataset.
Operational and Logistics Oversight
Operations and logistics managers benefit from visualizing data geographically and temporally. Fusedash allows them to upload shipment data or connect to logistics APIs to create detailed maps showing delivery routes, warehouse inventory levels, or regional sales performance. They can monitor real-time dashboards for key operational metrics, drill down into specific time periods to diagnose delays, and create narrative reports that explain weekly operational challenges and successes.
Cross-Departmental Data Democratization
Organizations aiming to become truly data-driven need to empower non-technical teams with self-service analytics. Fusedash's intuitive interface and AI Chat feature allow teams in sales, HR, or customer success to ask direct questions of their data without writing SQL. They can generate their own charts, apply filters, and build simple dashboards to track their team-specific goals, reducing dependency on data analysts and speeding up the cycle from question to insight.
Frequently Asked Questions
What types of data sources can I connect to Fusedash?
Fusedash is designed for flexibility in data ingestion. You can start by uploading static files like CSVs or Excel spreadsheets. For live, updating data, you can connect directly to various business application APIs, such as marketing platforms, CRM systems, or databases. The platform also allows you to combine multiple datasets—like your internal sales data with public demographic information—to create enriched, contextual views within a single workspace.
How does Fusedash ensure data consistency across reports?
Consistency is a foundational principle of Fusedash. The platform allows you to centrally define your key metrics, calculations, and dimensional segments (like "active user" or "QoQ growth"). Once these definitions are set, they become reusable building blocks. Every time you create a new dashboard, chart, or report, you select from these pre-defined metrics. This eliminates manual recalculations and ensures that a KPI on the executive dashboard is calculated identically to the same KPI on a team-level report.
Is the AI Chart Generator suitable for complex data analysis?
The AI Chart Generator is an excellent starting point for transforming raw data into clear, communicative visuals quickly. It excels at handling common chart types and comparisons to reveal initial trends and stories. For deeply complex, multi-layered statistical analysis, it serves as a powerful rapid prototyping tool. The generated charts can then be refined, combined with other data views, and integrated into comprehensive dashboards where further drill-down and advanced filtering can be performed for deeper analysis.
Can I share the dashboards and reports with external stakeholders?
Yes, Fusedash is built for collaboration and sharing insights. You can easily share the views you create—whether they are interactive dashboards, standalone charts, or narrative reports—with both internal team members and external stakeholders like clients or partners. Access can typically be controlled, allowing you to share read-only views or interactive dashboards with specific filters enabled, ensuring stakeholders see only the relevant data while interacting with the live insights.
Explore more in this category:
Similar to Fusedash
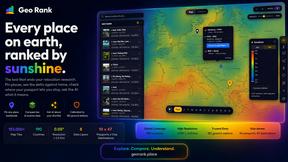
GeoRank
Planning a relocation or long-term stay abroad? Compare places on sunshine, cost, tax, visa access for your passport, then ask AI about your short

Video2URL
Turn video files into private, trackable share links in seconds.
InContekst
Decision support framework for high consideration businesses with mix of online and offline channels, content-rich sites, and long customer journeys.
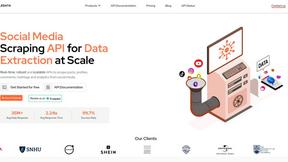
EnsembleData
EnsembleData provides real-time APIs to effortlessly scrape and analyze social media data for actionable business insights.
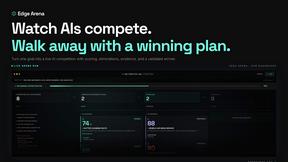
Edge Arena
Edge Arena empowers businesses to validate decisions through competing AI agents, delivering optimal, defendable action plans.
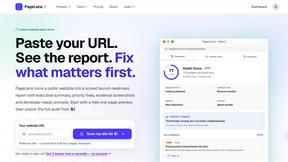
PageLens AI
PageLens AI audits AI-built websites, revealing launch risks and providing actionable fixes to ensure a safe and successful launch.
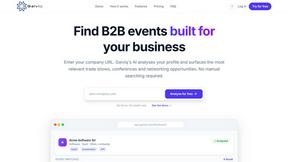
Galviq
Galviq's AI scans your company to instantly find the few B2B events truly worth your time.