Fallom vs Fusedash
Side-by-side comparison to help you choose the right AI tool.
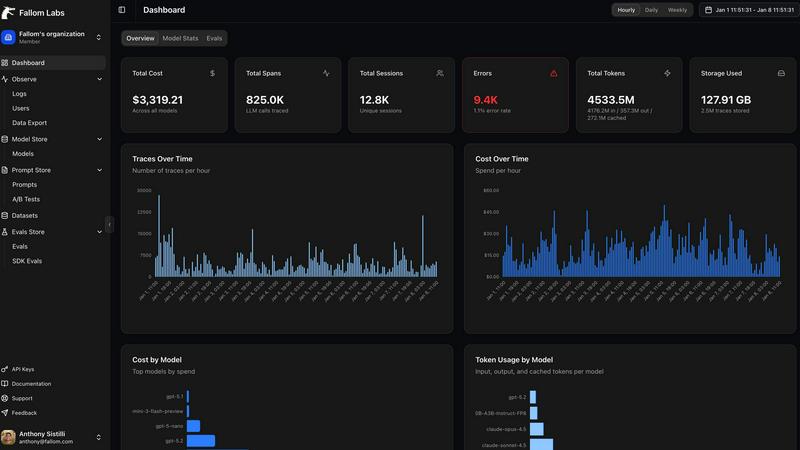
Fallom provides real-time observability for LLMs, enabling efficient tracking, analysis, and debugging of AI.
Last updated: February 28, 2026
Fusedash turns raw data into clear dashboards and charts for instant team insights.
Last updated: March 4, 2026
Visual Comparison
Fallom
Fusedash

Feature Comparison
Fallom
Real-time Observability
Fallom provides real-time observability into AI agent operations, allowing teams to track tool calls, analyze timing, and debug issues confidently. This feature ensures that all interactions are logged and available for immediate review, facilitating quick response to any anomalies.
Cost Attribution
With Fallom, organizations can monitor spending meticulously by tracking costs associated with each model, user, and team. This feature offers full cost transparency, enabling accurate budgeting and chargeback processes, essential for financial accountability in AI operations.
Compliance Ready
Fallom is built with compliance in mind, offering complete audit trails that support regulatory requirements such as the EU AI Act, SOC 2, and GDPR. This feature ensures organizations can maintain the necessary documentation and oversight required in regulated industries.
Session Tracking
The platform allows for comprehensive session tracking, grouping traces by session, user, or customer. This capability provides complete context around each interaction, making it easier to analyze user behavior and improve overall user experience.
Fusedash
Unified Visualization Workspace
Fusedash consolidates multiple data presentation formats into a single, cohesive environment. Instead of juggling separate tools for dashboards, charts, maps, and reports, teams can build all these views from the same connected dataset. This unified approach allows for seamless switching between interactive dashboards for monitoring, detailed charts for analysis, geographic maps for spatial context, and narrative storytelling reports for stakeholder communication, all while maintaining consistent data logic and definitions.
AI Chart Generator
This feature accelerates the initial step of data exploration by allowing users to generate clear, effective visuals from their data in minutes. By simply uploading a CSV or connecting an API, the AI assists in selecting the optimal chart type, applying relevant comparisons, and refining labels to ensure the visual accurately tells the data's story. These charts can be used as standalone assets for quick reports or seamlessly integrated into larger, more comprehensive dashboard views.
Consistent Metric Definitions
Fusedash addresses a fundamental pain point in data-driven organizations: metric inconsistency. Teams can define their core KPIs, dimensions, time comparisons, and segmentations once within the platform. These standardized definitions are then automatically applied and reused across every dashboard, chart, and report. This guarantees that everyone in the organization—from marketing to finance to the C-suite—is analyzing and making decisions based on the exact same calculations, building trust and eliminating debates over data accuracy.
Smart AI Chat for Data Exploration
Integrated directly into the workflow, the AI Chat function allows users to interact with their data using natural language. Users can ask plain-English questions about their datasets, request specific breakdowns, or seek suggestions for the most relevant metrics and visualizations. The AI interprets these queries and provides immediate answers, which can then be instantly transformed into a shareable, persistent view within a dashboard, dramatically speeding up the insight discovery process.
Use Cases
Fallom
Monitoring AI Workloads
Fallom is ideal for teams overseeing AI workloads, providing them with real-time insights into model performance, usage patterns, and operational costs. This ensures that teams can proactively manage their AI systems and respond to issues swiftly.
Debugging Multi-step Agents
For organizations utilizing multi-step agents, Fallom's timing waterfall feature aids in debugging latency issues by visualizing each step's duration. This allows teams to identify bottlenecks and optimize agent workflows effectively.
Financial Oversight
Companies can leverage Fallom for financial oversight, utilizing its cost attribution feature to track expenditures across different models and teams. This is crucial for organizations that require transparency in their AI spending and resource allocation.
Compliance Management
Fallom is a valuable asset for companies needing to adhere to strict compliance standards. Its complete audit trails and user consent tracking help organizations maintain regulatory compliance while ensuring user privacy and data security.
Fusedash
Executive Reporting and Leadership Alignment
Leadership teams require a high-level, consistent view of company performance without getting lost in data discrepancies. Fusedash enables the creation of executive dashboards that combine key financial, operational, and marketing KPIs into a single, real-time interface. By using standardized metric definitions, it ensures that the numbers presented to the board are the same ones used by department heads, fostering strategic alignment and confident, data-backed decision-making at the top level.
Marketing Campaign Performance Monitoring
Marketing teams need to track campaign metrics across multiple channels in real-time. With Fusedash, they can connect various ad platform APIs and data sources to build a unified campaign dashboard. They can visualize ROI, conversion rates, and customer acquisition costs through interactive charts, segment performance by region using maps, and use storytelling reports to summarize weekly performance and insights for stakeholders, all from one connected dataset.
Operational and Logistics Oversight
Operations and logistics managers benefit from visualizing data geographically and temporally. Fusedash allows them to upload shipment data or connect to logistics APIs to create detailed maps showing delivery routes, warehouse inventory levels, or regional sales performance. They can monitor real-time dashboards for key operational metrics, drill down into specific time periods to diagnose delays, and create narrative reports that explain weekly operational challenges and successes.
Cross-Departmental Data Democratization
Organizations aiming to become truly data-driven need to empower non-technical teams with self-service analytics. Fusedash's intuitive interface and AI Chat feature allow teams in sales, HR, or customer success to ask direct questions of their data without writing SQL. They can generate their own charts, apply filters, and build simple dashboards to track their team-specific goals, reducing dependency on data analysts and speeding up the cycle from question to insight.
Overview
About Fallom
Fallom is an advanced AI-native observability platform that focuses on providing real-time insights specifically for large language model (LLM) and agent workloads. Designed for teams operating in production environments, Fallom enables comprehensive visibility into every LLM call, offering end-to-end tracing capabilities. This includes meticulous tracking of prompts, outputs, tool calls, tokens, latency, and associated costs for each interaction. Fallom's primary value proposition is its ability to enhance operational efficiency by allowing teams to monitor usage patterns, debug issues, and accurately attribute spending across various models, users, and teams. The platform features session and user context, timing waterfalls for multi-step agent processes, and enterprise-grade audit trails, making it a suitable choice for organizations with compliance requirements. With a single OpenTelemetry-native SDK, teams can quickly implement Fallom within their applications for immediate live monitoring and maintenance of LLM workloads.
About Fusedash
Fusedash is an AI-powered data visualization platform designed to eliminate the friction and inconsistency of modern data reporting. It serves as a unified workspace where teams can transform their connected data—from CSVs, APIs, or databases—into clear, actionable insights. The platform consolidates the creation of decision-ready dashboards, interactive charts, detailed maps, and narrative reports, removing the need to rebuild the same logic across multiple, disconnected tools. Its core value proposition is delivering a single source of truth: you define your key metrics and KPIs once, and then reuse those consistent definitions across every view and report. This ensures alignment across the entire organization, from leadership to operations, so everyone is working from the same trusted numbers. Built for teams tired of manual reporting cycles and conflicting data stories, Fusedash empowers users to not only monitor real-time performance but also understand the 'why' behind the data through intuitive drill-downs. With integrated AI features like natural language data chat and smart visualization assistance, it makes data exploration and reporting faster and more accessible, turning raw data into a shared foundation for strategic alignment and decisive action.
Frequently Asked Questions
Fallom FAQ
What kind of insights can Fallom provide?
Fallom offers insights into LLM call metrics such as latency, costs, and user interactions, enabling teams to monitor performance and identify areas for improvement.
Is Fallom suitable for teams in regulated industries?
Yes, Fallom is designed to meet compliance needs, offering features like complete audit trails, privacy controls, and user consent tracking, making it ideal for organizations in regulated sectors.
How quickly can I set up Fallom?
Setting up Fallom is straightforward and can be completed in under five minutes using its OpenTelemetry-native SDK, allowing teams to get started with live monitoring immediately.
Can Fallom integrate with existing AI frameworks?
Fallom is compatible with all AI providers and uses a single SDK, ensuring that organizations can implement it without vendor lock-in and easily integrate it into their existing systems.
Fusedash FAQ
What types of data sources can I connect to Fusedash?
Fusedash is designed for flexibility in data ingestion. You can start by uploading static files like CSVs or Excel spreadsheets. For live, updating data, you can connect directly to various business application APIs, such as marketing platforms, CRM systems, or databases. The platform also allows you to combine multiple datasets—like your internal sales data with public demographic information—to create enriched, contextual views within a single workspace.
How does Fusedash ensure data consistency across reports?
Consistency is a foundational principle of Fusedash. The platform allows you to centrally define your key metrics, calculations, and dimensional segments (like "active user" or "QoQ growth"). Once these definitions are set, they become reusable building blocks. Every time you create a new dashboard, chart, or report, you select from these pre-defined metrics. This eliminates manual recalculations and ensures that a KPI on the executive dashboard is calculated identically to the same KPI on a team-level report.
Is the AI Chart Generator suitable for complex data analysis?
The AI Chart Generator is an excellent starting point for transforming raw data into clear, communicative visuals quickly. It excels at handling common chart types and comparisons to reveal initial trends and stories. For deeply complex, multi-layered statistical analysis, it serves as a powerful rapid prototyping tool. The generated charts can then be refined, combined with other data views, and integrated into comprehensive dashboards where further drill-down and advanced filtering can be performed for deeper analysis.
Can I share the dashboards and reports with external stakeholders?
Yes, Fusedash is built for collaboration and sharing insights. You can easily share the views you create—whether they are interactive dashboards, standalone charts, or narrative reports—with both internal team members and external stakeholders like clients or partners. Access can typically be controlled, allowing you to share read-only views or interactive dashboards with specific filters enabled, ensuring stakeholders see only the relevant data while interacting with the live insights.
Alternatives
Fallom Alternatives
Fallom is a cutting-edge observability platform designed for large language models (LLMs) and AI agent workloads. It specializes in providing real-time insights and detailed tracking of LLM interactions in production environments. Users often seek alternatives to Fallom for various reasons, including pricing concerns, feature sets that better align with specific needs, or compatibility with existing platforms. When searching for an alternative, it is crucial to consider factors such as real-time observability capabilities, user context accessibility, cost attribution features, and compliance with industry standards. --- [{"question": "What is Fallom?", "answer": "Fallom is an AI-native observability platform tailored for large language models and agent workloads, offering real-time tracking and analysis."}, {"question": "Who is Fallom for?", "answer": "Fallom is designed for teams managing AI operations who require efficient monitoring, debugging, and cost attribution for LLM workloads."}, {"question": "Is Fallom free?", "answer": "The pricing details for Fallom are not specified, and potential users should inquire directly for information on costs."}, {"question": "What are the main features of Fallom?", "answer": "Main features of Fallom include real-time observability, session and user context tracking, detailed cost attribution, and compliance-focused audit trails."}]
Fusedash Alternatives
Fusedash is an AI-powered data visualization and business intelligence platform. It helps teams unify their data to create consistent, decision-ready dashboards and reports, ensuring everyone works from a single source of truth. Users often explore alternatives for various reasons. These can include budget constraints, the need for specific integrations, different user-skill requirements, or a desire for more specialized analytical features. The search for the right tool is highly personal to a team's unique data stack and workflow. When evaluating options, consider your core needs. Key factors often include ease of use for your team's technical level, the ability to connect to your essential data sources, the robustness of collaboration features, and the total cost of ownership. The goal is to find a solution that turns data into a reliable asset for alignment and action.