conceptviz vs Trafficclaw
Side-by-side comparison to help you choose the right AI tool.
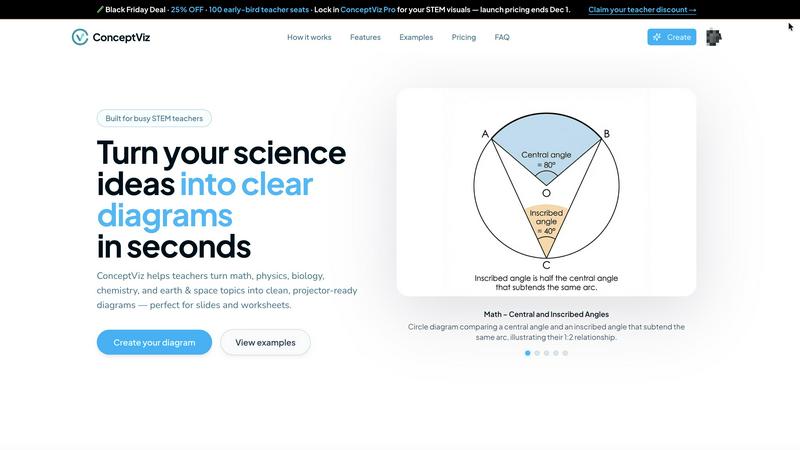
ConceptViz simplifies complex science and math concepts into clear, ready-to-use diagrams for educators and researchers.
Last updated: March 1, 2026
Trafficclaw
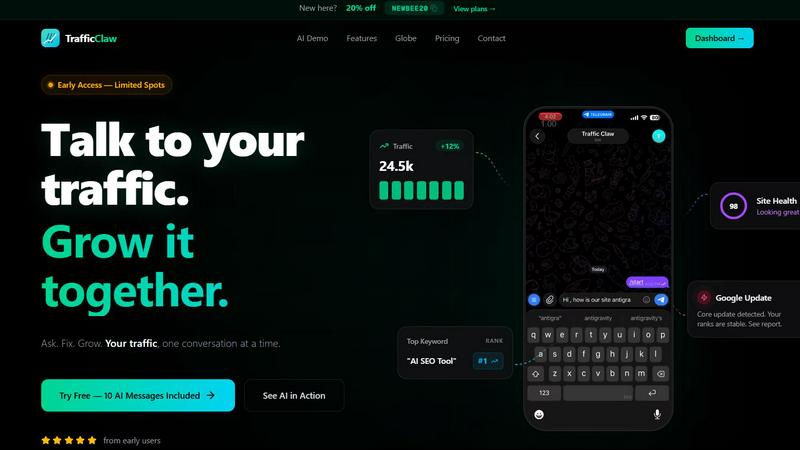
TrafficClaw is an AI analyst that answers questions and delivers growth insights from your live SEO and analytics data.
Last updated: April 13, 2026
Visual Comparison
conceptviz
Trafficclaw
Feature Comparison
conceptviz
User-Friendly Interface
ConceptViz boasts an intuitive interface that allows users to easily navigate through the diagram creation process. With just a few clicks, users can generate high-quality visuals without needing any prior design skills, making it accessible for everyone.
Quick Diagram Generation
The platform enables users to create classroom-ready diagrams in seconds. By simply entering a plain-English description of the desired visual, ConceptViz instantly produces a tailored diagram, saving educators and students valuable time during lesson preparation.
Projector-Ready Clarity
All diagrams generated by ConceptViz are designed with high contrast and legible labels, ensuring that visuals remain sharp and clear, whether viewed from the front row or the back of the classroom. This focus on clarity enhances the teaching and learning experience.
Subject and Grade Presets
ConceptViz offers a variety of presets tailored to different subjects and educational levels, including physics, biology, chemistry, and math. These presets align with U.S. grade bands, allowing users to select the appropriate level of complexity for their diagrams, making it easier to cater to diverse learning environments.
Trafficclaw
AI Analyst Chat
This is the core of TrafficClaw. Engage in natural language conversation with an AI trained on your live analytics and SEO data. Ask specific questions about traffic trends, user behavior, or performance drops. The AI doesn't offer blog-style advice; it analyzes your connected data sources and delivers precise verdicts with evidence, often accompanied by charts and direct insights for immediate action.
SEO Intelligence Suite
Go beyond basic rankings. This feature proactively monitors your SEO health with advanced capabilities. It detects keyword gaps you can target, alerts you to content decay on older pages, identifies cannibalization issues where your pages compete against each other, and provides tools optimized for AI search engines. It turns raw search data into a strategic growth roadmap.
Integrated Analytics Dashboard
TrafficClaw unifies critical metrics into a single, intelligently designed overview. View real-time visitor counts, traffic trends, bounce rates, and conversion funnels side-by-side with your SEO data. This eliminates the need to constantly jump between GA4, Search Console, and other platforms, providing a holistic view of your site's performance in one glance.
Live Visitor Globe & Embed
A unique visual feature that displays your real-time GA4 traffic on an interactive 3D globe. See where your current visitors are located globally, with a live activity feed showing page views and exits. You can also generate an embed code to showcase this live globe on your own website, adding dynamic social proof without any additional tracking scripts.
Use Cases
conceptviz
Classroom Instruction
Teachers can utilize ConceptViz to create visually engaging diagrams that simplify complex topics for their students. From illustrating the structure of a cell to demonstrating energy transformations in physics, diagrams enhance understanding and retention.
Homework Assistance
Students can leverage ConceptViz to create clear visuals for their assignments, making their work more impactful and easier to comprehend. Whether it's a labeled diagram of a plant cell or a ray diagram for optics, students can illustrate their concepts effectively.
Research Publications
Researchers can quickly generate precise figures for their publications, ensuring that their visuals accurately represent their findings. ConceptViz helps streamline the process of creating scientific diagrams, making it an invaluable tool for academics.
Collaborative Projects
In group settings, students can use ConceptViz to collaborate on projects, creating diagrams that visually represent their collective understanding of complex topics. This collaborative feature fosters teamwork and enhances learning through shared visual aids.
Trafficclaw
Diagnosing Sudden Traffic Drops
When your analytics show an unexplained traffic decline, instead of manually cross-referencing data for hours, simply ask the AI Analyst "Why did my traffic drop?" It will analyze your connected GA4 and Search Console data, pinpointing causes such as a Google algorithm update impact, a specific page losing rankings, or a technical issue, and provide the evidence-backed reason.
Uncovering Content & Keyword Opportunities
Identify growth levers without manual research. Ask questions like "What are my top untapped keyword opportunities?" or "Which old blog posts need updating?" The AI sifts through your search performance data to highlight content gaps, pages suffering from decay, and high-potential keywords you're not yet ranking for, directing your content efforts effectively.
Real-Time Website Performance Monitoring
Keep a pulse on your site's immediate activity and health. Use the unified dashboard to watch real-time visitor flow, geographic distribution, and on-site behavior concurrently with core SEO metrics. This is invaluable for monitoring campaign launches, site changes, or immediate reactions to industry news.
Streamlining Client or Stakeholder Reporting
For agencies or teams, TrafficClaw simplifies communication. The clear, conversational insights and visual dashboard provide an easily digestible snapshot of performance. You can quickly generate answers to specific stakeholder questions or use the live embed globe to transparently showcase site activity and engagement directly to clients.
Overview
About conceptviz
ConceptViz is a cutting-edge diagram creation tool tailored for educators, students, and researchers within STEM fields. This innovative platform allows users to transform intricate scientific concepts into clear, visually appealing diagrams in just seconds. Whether you are a K-12 teacher crafting lesson plans, a student working on assignments, or a researcher in need of precise visuals for publications, ConceptViz offers a user-friendly experience that meets the needs of all educational levels. By emphasizing clarity and usability, it ensures that diagrams are not only projector-ready but also perfectly suited for handouts. The tool’s unique feature of generating custom visuals from simple text descriptions makes it an essential resource for enhancing comprehension and engagement in science and mathematics education, streamlining the process of creating educational materials that resonate with learners.
About Trafficclaw
TrafficClaw is an AI-powered analytics command center designed to cut through the noise of traditional data tools. It transforms the complex, often frustrating task of understanding website performance into a simple conversation. By connecting directly to your Google Analytics 4 and Google Search Console accounts, TrafficClaw provides an AI analyst with real-time access to your data. Instead of staring at static graphs and exporting spreadsheets, you can ask direct questions like "Why did my traffic drop last Tuesday?" or "What are my top keyword opportunities?" and receive specific, actionable verdicts backed by your own metrics. It's built for website owners, marketers, and developers who value their time and seek direct, intelligent insights over generic advice. The core promise is effortless growth: stop switching between tabs, start having a dialogue with your data, and get clear fixes to drive your traffic forward.
Frequently Asked Questions
conceptviz FAQ
What types of diagrams can I create with ConceptViz?
ConceptViz allows users to create a wide variety of diagrams, including those for biology, physics, chemistry, and mathematics. You can generate anything from cell structures to energy diagrams, tailored to different educational levels.
Is there a learning curve for using ConceptViz?
Not at all! ConceptViz is designed with a user-friendly interface that makes it easy for anyone to create diagrams without any prior design experience. The step-by-step process ensures that you can start generating visuals immediately.
Can I use ConceptViz for presentations?
Yes, all diagrams created with ConceptViz are projector-ready and can easily be integrated into presentations. You can download them in high-resolution PNG format, making them perfect for PowerPoint, Google Slides, or printed materials.
Is there a free trial available?
ConceptViz offers a free version that allows users to explore its features and create diagrams without requiring a credit card. This trial provides an excellent opportunity to assess the tool's capabilities before making a purchase.
Trafficclaw FAQ
How does TrafficClaw access my data?
TrafficClaw uses secure, read-only Google OAuth to connect to your Google Analytics 4 and Search Console accounts. This means we never see your password, and our access is limited to viewing your analytics data only. Your data remains in your Google account and is not sold or used for training public AI models.
What makes the AI advice different from generic tips?
The AI Analyst is fundamentally different because it operates on your live, first-party data. Instead of giving general best practices, it analyzes your specific traffic patterns, keyword rankings, and user behavior to deliver personalized verdicts. The insight "your traffic dropped because page X lost its #3 ranking for keyword Y" is actionable, whereas "create better content" is not.
Is there a setup or coding required?
Setup takes less than a minute and requires no coding. You simply sign in with Google, grant read-only permissions to your GA4 and Search Console properties, and TrafficClaw auto-detects and imports your data. Your dashboard and AI Analyst are ready to use immediately after.
Can I use the Live Globe on my website?
Yes. The Live Visitor Globe is a feature available to all users. You can generate a unique embed code from your TrafficClaw dashboard and insert it as a simple iframe into any webpage, CMS like WordPress, or custom-coded site. It will then display real-time visitor data from your connected GA4 property without requiring any additional tracking code on your site.
Alternatives
conceptviz Alternatives
ConceptViz is a specialized diagram creation tool tailored for educators, students, and researchers in STEM fields. It simplifies the visualization of complex scientific and mathematical concepts, making it easier for users to produce clear, classroom-ready diagrams within seconds. As a tool in the categories of AI Assistants, Content Creation, Data Visualization, and Design Tools, ConceptViz appeals to a diverse audience looking to enhance their teaching and learning experiences. Users often seek alternatives to ConceptViz for several reasons, such as pricing concerns, the need for specific features, or compatibility with their preferred platforms. When considering alternatives, it is essential to evaluate the ease of use, the quality of visuals generated, and whether the tool meets the unique demands of your educational or professional context. Choosing the right tool can significantly impact the effectiveness of communication in science and mathematics.
Trafficclaw Alternatives
Trafficclaw is an AI assistant for SEO and analytics, designed to translate complex data into actionable insights. It connects to platforms like Google Analytics and Search Console, allowing users to ask direct questions about their traffic and performance to receive clear, data-backed answers. Users explore alternatives for various reasons, such as budget constraints, the need for different feature sets, or integration with a broader tech stack. Some may require more advanced reporting, team collaboration tools, or support for additional data sources beyond the core offerings. When evaluating other solutions, prioritize tools that offer genuine conversational analysis, not just dashboards. Look for robust, secure data connections, transparent pricing, and a focus on delivering specific, corrective insights rather than just surfacing problems.