
LoadTester
LoadTester runs distributed HTTP and API load tests from your browser or CI/CD without infrastructure, delivering live analytics and threshold-based.
Visit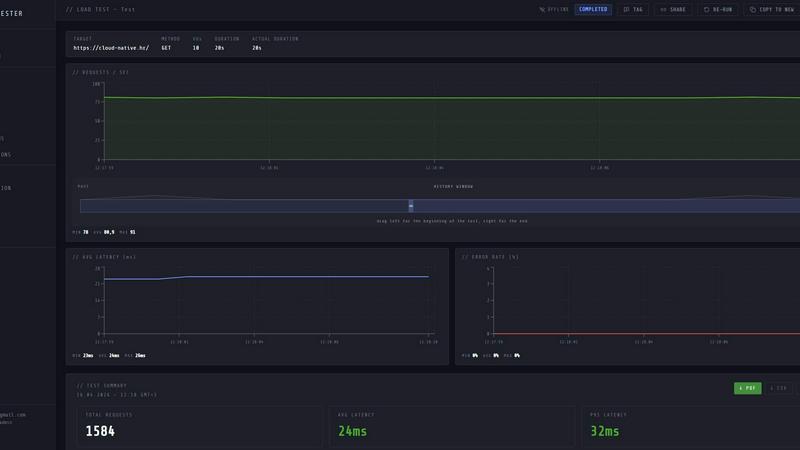
About LoadTester
LoadTester is a modern HTTP and API load testing tool built by Cloud Native d.o.o. that removes the traditional overhead of performance testing. It is designed for engineering teams who need repeatable, reliable performance checks without managing any infrastructure. Instead of provisioning servers, configuring workers, or wrestling with orchestration, teams can create a test, choose between virtual users or requests per second, and launch a distributed load test from their browser or CI/CD pipeline in under three seconds. The tool provides live analytics during the run, including throughput, latency distributions, and error rates, so teams can monitor behavior in real time. After the test completes, LoadTester surfaces a clean summary with total requests, average latency, p95 and p99 values, and data transfer metrics. Teams can compare runs side by side, set thresholds for auto-stop on failure or latency breaches, schedule tests as nightly baselines, and integrate results into workflows via webhooks, Slack, email, and API access. The core value proposition is simplicity without sacrificing depth: developers get the precision of distributed load testing with the ease of a SaaS tool. It supports up to 10,000 virtual users and 10,000 requests per second, with a cold start time under three seconds and a typical run success rate of 99.8 percent. LoadTester is built for teams that want to catch performance regressions before users notice, ship with confidence, and prove capacity before launch.
Features of LoadTester
Instant Execution, Distributed by Default
LoadTester eliminates the complexity of setting up load testing infrastructure. From the moment you create a test, the platform automatically dispatches distributed workers that scale to meet the demand of your scenario. Cold start to first request takes under three seconds, and there is no queue time for worker allocation. This means your team can focus on interpreting results and improving performance rather than managing servers, orchestration, or scheduling headaches.
Live Analytics and Real-Time Telemetry
While a test is running, LoadTester streams live metrics directly to your dashboard. You can watch throughput in requests per second, latency distributions at p50, p95, and p99, active virtual user counts, and error rates update in real time. This live view allows you to spot bottlenecks, anomalous spikes, or degradation as they happen, rather than waiting for a post-run report. The latency distribution chart over the last 60 seconds gives immediate visual feedback on system behavior under load.
Smart Auto-Stop with Thresholds
LoadTester lets you define guardrails that automatically stop a test when conditions are breached. You can set thresholds for p95 latency, error rate percentage, or regression compared to a baseline run. When a threshold is exceeded, the test stops immediately, preventing wasted resources and alerting your team to the issue. This capability is critical for CI/CD pipelines where you need automated pass or fail decisions without manual intervention.
CI/CD Ready with Webhooks and Alerts
LoadTester integrates directly into your development workflow. You can trigger tests from any CI/CD pipeline, schedule recurring runs for nightly baselines, and receive notifications via Slack, email, or custom webhooks. When a test completes, a webhook can post the result link to a release bot, notify your team of regressions, or trigger downstream actions. This automation makes performance testing a seamless part of your deployment process rather than a separate manual activity.
Use Cases of LoadTester
Pre-Release Performance Validation
Before shipping a new feature or deployment, engineering teams can run a targeted load test against the staging or production endpoint. By setting p95 latency and error rate thresholds, the team can validate that the change does not introduce performance regressions. If the test fails, the deployment can be automatically blocked or flagged for review. This use case ensures that performance is verified before users ever experience slowdowns.
Nightly Baseline Monitoring
Teams can schedule LoadTester to run a consistent set of tests every night against critical API endpoints. Over time, these scheduled runs build a historical baseline of performance metrics. When a nightly test shows a significant deviation from the baseline, such as a 15 percent increase in p95 latency, the team receives an alert. This proactive monitoring catches regressions caused by database changes, configuration updates, or infrastructure modifications before they impact daytime traffic.
Capacity Planning and Spike Testing
When preparing for a product launch, marketing campaign, or seasonal traffic spike, teams need to know if their system can handle the load. LoadTester allows you to simulate a spike by specifying a high number of virtual users or requests per second over a defined duration. The live analytics show how the system behaves under peak pressure, including latency degradation and error rates. This data informs decisions about scaling, caching, or architecture changes before the real traffic arrives.
CI/CD Pipeline Gate
LoadTester can act as a quality gate in your continuous integration and continuous deployment pipeline. Every time a pull request is merged or a build is promoted, the pipeline triggers a load test against the relevant endpoint. If the test passes all thresholds, the pipeline proceeds. If it fails, the build is halted and the team is notified. This automated check prevents performance bugs from reaching production and keeps the team accountable for maintaining speed and reliability with every change.
Frequently Asked Questions
How does LoadTester handle infrastructure and scaling?
LoadTester is a fully managed SaaS platform. You do not need to provision any servers, configure load generators, or manage worker orchestration. When you launch a test, the platform automatically dispatches distributed workers that scale to meet the demands of your scenario. The cold start time from test creation to first request is under three seconds. All infrastructure coordination, scaling, and execution flow are handled by the platform so your team can focus on analyzing results.
What metrics are available during a live test?
During a live test, LoadTester streams real-time metrics including requests per second, p50, p95, and p99 latency, active virtual user count, and total error count. A latency distribution chart shows the last 60 seconds of p50, p95, and p99 values over time. After the test completes, the summary includes total requests, average latency, p95, data sent, data received, and success rate. You can also export results as PDF, CSV, or JSON for further analysis or sharing.
Can I integrate LoadTester with my CI/CD pipeline?
Yes. LoadTester is designed for CI/CD integration. You can trigger tests from any pipeline using the API, schedule recurring tests for nightly baselines, and configure webhooks to send results to release bots, Slack channels, or email. Thresholds can be set to automatically fail the test if latency or error rates exceed limits, which allows the pipeline to make pass or fail decisions without manual review.
Is there a free plan available?
Yes. LoadTester offers a free plan that allows teams to get started without any upfront commitment. The free plan includes the ability to create and run tests, view live analytics, and review completed results. For teams that need higher throughput limits, more concurrent runs, or advanced features like scheduled tests and API access, there are paid plans available. You can view the specific limits and pricing on the LoadTester website.
Similar to LoadTester

NeutrixFlow
AI tools directory with practical reviews, comparisons, and guides.



Firma.dev
Pay-as-you-go e-signature API and no-code sending. €0.049 per envelope, no monthly minimums, legally valid in 55+ countries.